Parameter set section
Brand Designer
2025
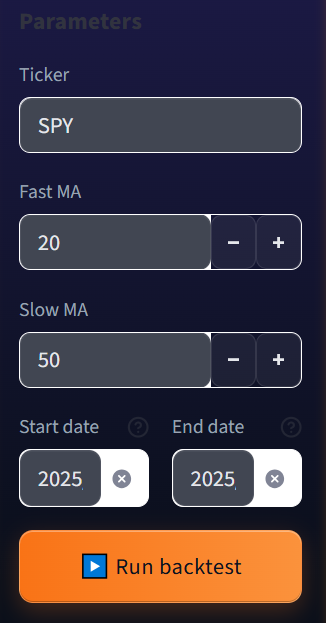
Pick your inputs:
Enter a ticker (e.g., SPY), choose Fast MA and Slow MA, optionally set a start/end date.
Click “Run backtest.”
We fetch market data
Prices come from Yahoo Finance (via yfinance in python).
We use OHLC / Adjusted Close when available, with caching for fast loads and sensible fallbacks.
Inputs & validation
• Ticker: any Yahoo Finance symbol (e.g., SPY, AAPL, BTC-USD).
• Fast MA / Slow MA: positive integers; Fast must be < Slow. (Very large windows are flagged.)
• Date range: optional—leave blank for full history.
• Robustness: handles missing columns, NaNs, and multi-symbol (MultiIndex) data safely.
Overview
See headline metrics, a price chart with your fast/slow moving averages, strategy vs. buy-and-hold equity curves, an interactive candlestick view, and a one-click CSV download of results.
Strategy tab
Table with Price, MA(fast), MA(slow), and the binary Signal (1 = long, 0 = flat) for the latest ~200 points—perfect for auditing MA crossovers and understanding entries/exits.
Research (ML) tab
A simple logistic-regression demo uses MA features and recent return to forecast P(up next day), shows hold-out accuracy from a basic train/test split, and plots the probability line (0–1).
Data tab
Raw series view: Quick view of the last 1,000 price points used in your run so you can verify symbols, dates, and data quality.
Data tab
Settings tab
Theme controls: Uses Streamlit dark theme with custom palette. You can tweak theme in the app menu or via config.toml.
Backtest & Metrics
We simulate a moving-average crossover strategy with next-day execution and compare it to a Buy-&-Hold baseline.
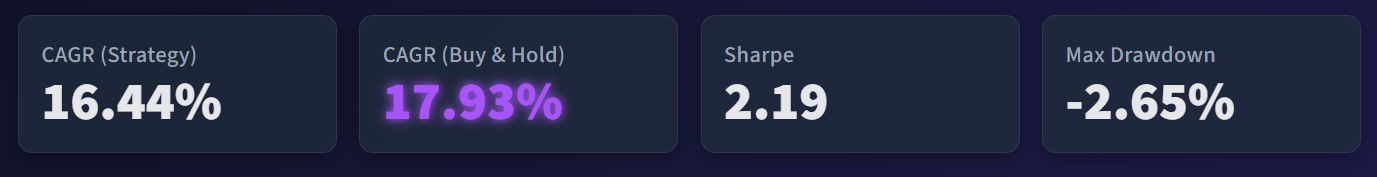
Your run produces four headline metrics:
• CAGR (Strategy): annualized growth of the strategy’s equity. Higher is better.
• CAGR (Buy & Hold): annualized growth if you simply stayed invested. Benchmark for comparison.
• Sharpe: return per unit of volatility (risk-adjusted). Higher is better.
• Max Drawdown: worst peak-to-trough drop in the equity curve. Closer to 0% is better.
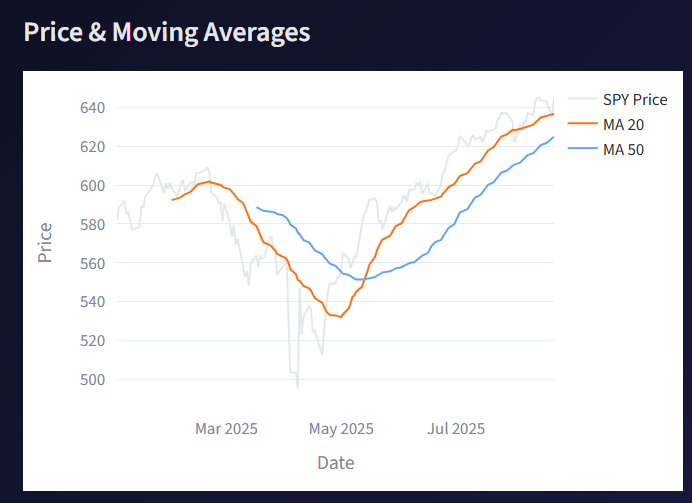
Price & Moving Averages: Line chart showing price with your fast/slow MA windows.
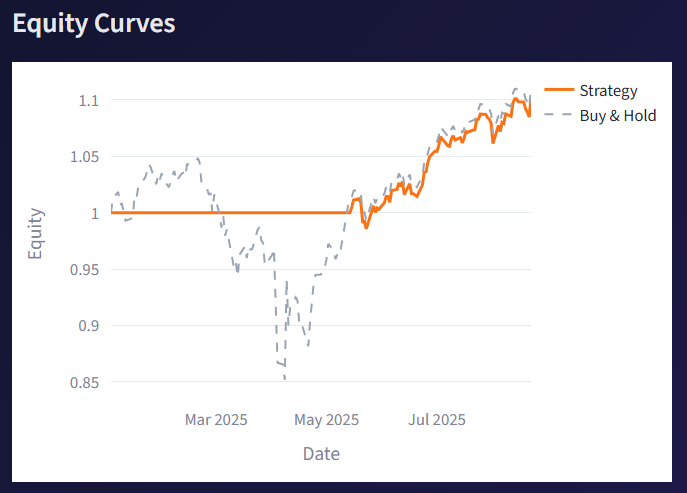
Equity Curves:
Strategy vs. Buy‑&‑Hold, so you can see relative performance over time.
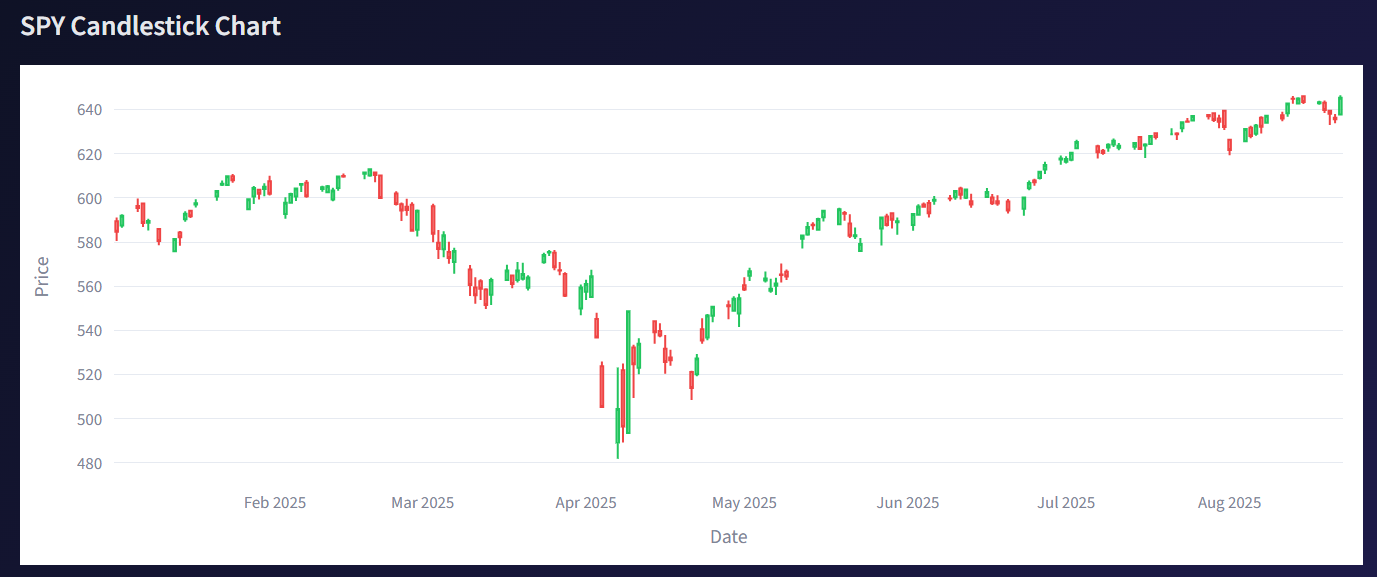
Candlestick chart:
Interactive OHLC view to inspect recent price action.
Note: purely educational—meant to inspire further research.
Downloads:
One‑click CSV export of the full backtest (equities + signals).